How to Fix Largest Contentful Paint (LCP) on WordPress
Search Console or PageSpeed Insights says your LCP is too slow. Find the LCP element, see which of its four parts is slow, and fix the hero image, server time or render blocking.
Search Console’s Core Web Vitals report has flagged a group of pages with “LCP issue: longer than 2.5s (mobile)”, or PageSpeed Insights shows Largest Contentful Paint in orange or red. Your site may feel fine on your office Wi-Fi. On a real visitor’s phone, the main content is taking too long to appear.
This guide explains what LCP measures, how to find exactly which element is slow and why, and the fixes that work on WordPress sites built with themes and page builders. It is for site owners who want to understand the report and the developers or designers who will make the changes. Broader speed problems are covered in slow websites: images, fonts and animations and high TTFB; responsiveness after load is in poor INP.
What is happening
Largest Contentful Paint is the time from when the visitor starts loading the page until the largest image or text block visible in the first screen has been drawn. Elements that can count include <img> images, the poster image of a <video>, an image loaded as a CSS background-image, and block-level text such as a heading or paragraph.
Google’s thresholds, from web.dev, are measured at the 75th percentile of page loads, separately for mobile and desktop:
LCP
Rating
2.5 seconds or less
Good
Over 2.5 and up to 4 seconds
Needs improvement
Over 4 seconds
Poor
The 75th percentile means three out of four visits must be at or under 2.5 seconds for the page to pass. A fast experience on your laptop does not count for much if most of your visitors arrive on phones over mobile data.
The four parts of LCP
web.dev and Chrome break LCP into four subparts that add up to the total. Knowing which part is large tells you which fix to apply.
From the start of navigation until the first byte of HTML arrives.
No page cache, slow hosting, heavy plugins running on every request, redirects, a distant server with no CDN.
Resource load delay
From TTFB until the browser starts downloading the LCP image. Zero for text.
The hero image is lazy-loaded, set as a CSS background, inserted by JavaScript (sliders), or discovered late behind other files.
Resource load duration
How long the LCP image takes to download.
An oversized image (a 4000 pixel photo shown at 400 pixels), old formats, no CDN.
Element render delay
From the image finishing (or TTFB, for text) until the element is actually painted.
Render-blocking CSS and JavaScript, web fonts hiding text, builder entrance animations that keep content invisible until a script runs.
web.dev’s own analysis of real-world data notes that the download itself is often not the biggest part; the delays before and after usually matter more. So “compress the image” is not always the answer.
Field data versus lab data
Search Console and the top of PageSpeed Insights show field data from the Chrome User Experience Report: real Chrome users over the previous 28 days. The lower part of PageSpeed Insights and Lighthouse show lab data: one simulated load on a throttled phone. Field data is what Google uses; lab data is what you can test changes with today. They will not match exactly. Because field data is a 28-day rolling window, a fix takes weeks to show fully in Search Console.
Before you start
Access: WordPress administrator, Search Console, and access to your caching plugin, page builder and, ideally, your hosting panel.
Browser: desktop Chrome or another Chromium browser for the DevTools steps.
A staging copy if you can, because some fixes involve changing theme or builder settings.
A baseline: save a PageSpeed Insights report for each problem template before you change anything, so you can prove what helped.
Step 1: Find which pages and which element
In Search Console, open Experience > Core Web Vitals, choose Mobile, and click the LCP issue. Search Console groups similar URLs together and gives example URLs. A group usually corresponds to a template: all blog posts, all product pages, the home page.
Run one example URL from each group through PageSpeed Insights, on the Mobile tab.
Scroll to the diagnostics and find the Largest Contentful Paint element item (in newer versions it sits under an LCP breakdown insight). It names the element, such as an img with its file name, or an h1, and shows the subpart timings for the lab test.
Note whether the LCP element is an image or text, and whether it is the same element on every page of the group. On mobile it is often different from desktop: a big heading may be the LCP element on a phone while a wide photo wins on desktop.
Step 2: Measure the subparts in Chrome DevTools
Open the page in a private window (so extensions and logged-in toolbars do not interfere) and open DevTools with F12 or Cmd+Option+I.
Go to the Performance panel. The opening view shows live Core Web Vitals for your own visit, including LCP and the element.
Use the settings to apply CPU throttling (4x slowdown) and network throttling (such as Fast 4G or Slow 4G) so the test resembles a phone.
Click the Record and reload button. When it finishes, open the Insights sidebar and choose LCP breakdown. It shows the four subparts with times and highlights the element.
Also look at LCP request discovery if listed: it checks whether the image was discoverable in the HTML, was lazy-loaded, and had high fetch priority.
The biggest subpart decides your next step: TTFB goes to Step 3, resource load delay to Step 4, load duration to Step 5, and render delay to Step 6.
You can also check the HTML for the hero image without opening DevTools. On your computer:
curl -sL downloads the page following redirects, grep -oE prints each <img> tag on its own line, and head -n 5 keeps the first five, which are the ones nearest the top of the page. Good: the hero image has fetchpriority="high" and no loading="lazy". Bad: the hero has loading="lazy", a data-src or data-lazy-src attribute instead of src (a lazy-load script will swap it in later), or it does not appear at all because it is a CSS background or injected by a slider script.
Step 3: Fix a large TTFB
If the HTML itself takes more than about 800 milliseconds to start arriving (web.dev’s rough guide for a good TTFB), nothing else can be fast. Common fixes, in order:
Turn on full-page caching so most visitors get a stored copy of the HTML instead of WordPress building it each time. Check it is working: the response headers should show a cache HIT on a second request. Our speed tool and headers tool show this.
Remove redirects on the way in. A link to http://example.com that redirects to https://www.example.com/ adds a full round trip to every visit. See one-hop redirects.
-o /dev/null throws away the page (use NUL on Windows), and -w prints the time until the first byte and the total time, in seconds. Run it three times; the first may be a cache miss. Numbers consistently above about 0.8 seconds for a cached page point to the server.
Step 4: Fix resource load delay (the hero image starts too late)
Stop lazy-loading the LCP image
Lazy loading is good for images further down the page and bad for the one at the top. A lazy-loaded hero is not requested until the browser has laid out the page and worked out it is visible. Lighthouse flags this as “Largest Contentful Paint image was lazily loaded”.
WordPress core already tries to skip lazy loading for the first content images and, since WordPress 6.3, adds fetchpriority="high" to the image it judges most likely to be the LCP element. Themes, page builders and optimization plugins often override this by lazy-loading everything. Look in these places:
Your optimization or caching plugin’s lazy-load settings: most have an option to skip the first few images, or an exclusion list where you add the hero image’s file name or CSS class.
Your page builder’s image or performance settings: several have their own lazy loading for images and backgrounds, which can be turned off per element or excluded for above-the-fold sections.
Your image optimization or CDN plugin, which may rewrite src to data-src.
Give the LCP image high priority
The fetchpriority="high" attribute tells the browser to fetch this image ahead of other images. If your hero is a normal image element and WordPress did not add it, add it through your builder’s attribute field or the theme template:
Use it on one image per page, the real LCP image. Marking everything high priority means nothing is.
Make the image discoverable in the HTML
The browser’s preload scanner only finds images that appear as <img> elements in the HTML. Three common hero patterns hide the image:
CSS background images set in a stylesheet. The browser has to download and parse the CSS first. Switch the hero to an image element (most builders offer an image or “background image as img” option), or preload it as shown below.
Sliders and carousels that build slides with JavaScript. The first slide’s image is not requested until the slider script runs. Replace the slider with a single static hero, which is also better for most visitors, or use a slider that outputs the first slide as plain HTML.
Images inserted after a consent or personalization script runs. Move them out of that dependency.
When you cannot change the markup, a preload link in the <head> makes the browser start early. Many optimization plugins have a “preload LCP image” option that generates this; otherwise:
Preload only the image that really is the LCP element on that template, and only on that template; a sitewide preload of a home page hero wastes bandwidth everywhere else. If the image is on a different domain (a CDN), add a preconnect to that domain as well.
Step 5: Fix resource load duration (the hero image is too heavy)
Serve the right size. A phone does not need a 2560 pixel image. Make sure the image has a srcset so the browser can choose a smaller version; WordPress generates one for images inserted from the Media Library, but builders and custom HTML sometimes output the full size only. See thumbnails and image sizes.
Use a modern format. WordPress supports WebP and AVIF uploads (AVIF from version 6.5) if your server’s image library supports them; optimization plugins can convert existing images.
Compress sensibly. A hero photo can usually be reduced a long way before anyone notices.
Serve from a CDN if visitors are spread out geographically.
Check what the browser actually downloaded in DevTools Network, filtered to Img: the size column shows bytes transferred, and hovering over the image in Elements shows its rendered size compared with its intrinsic size.
Step 6: Fix element render delay
The image or text is ready but the browser cannot or does not paint it yet.
Entrance animations
Builder animations such as “fade in up” on the hero section start the element invisible and reveal it with JavaScript. The LCP element cannot be painted until the animation runs, and if a speed plugin delays JavaScript until user interaction, it may not run until the visitor moves the mouse. Remove entrance animations from anything in the first screen. This is one of the most common LCP problems on builder sites and one of the easiest to fix.
Render-blocking CSS and JavaScript
Stylesheets in the <head> and scripts without defer or async block rendering. Reduce them by removing unused plugins, using your optimization plugin’s critical CSS or “remove unused CSS” feature carefully, and deferring non-essential scripts. Test thoroughly afterward, because aggressive settings break menus and forms; broken after Delay JS explains how to find the script that needs an exclusion.
Web fonts and text LCP
If the LCP element is a heading, a web font that has not loaded can hide the text. Use font-display: swap (or optional), self-host fonts instead of loading them from a third party, preload the one font file used for the heading, and use fewer font weights. See fonts showing as Times New Roman for how fonts are loaded and fixing CLS for keeping the font swap from shifting the layout.
Cookie banners
On a phone, a consent banner with a paragraph of text can itself become the LCP element, and its script may load late from a third-party domain. Shorten the text and load the banner script early. See cookie banner problems.
Step 7: Validate and wait
Re-test each template in PageSpeed Insights and DevTools. Compare the LCP breakdown with your baseline.
Purge every cache layer so real visitors receive the new version.
In Search Console, open the issue and click Validate fix. Search Console then monitors the URLs over a 28-day period before marking it passed or failed.
Watch the field data in PageSpeed Insights over the following weeks. It updates gradually as old visits fall out of the 28-day window.
If lab results are good but field data stays poor, your real visitors may be on slower devices or networks than your test settings, or the problem may be on pages or states you did not test (logged-in users, visitors arriving from ads with tracking parameters that skip the cache, or another country far from your server).
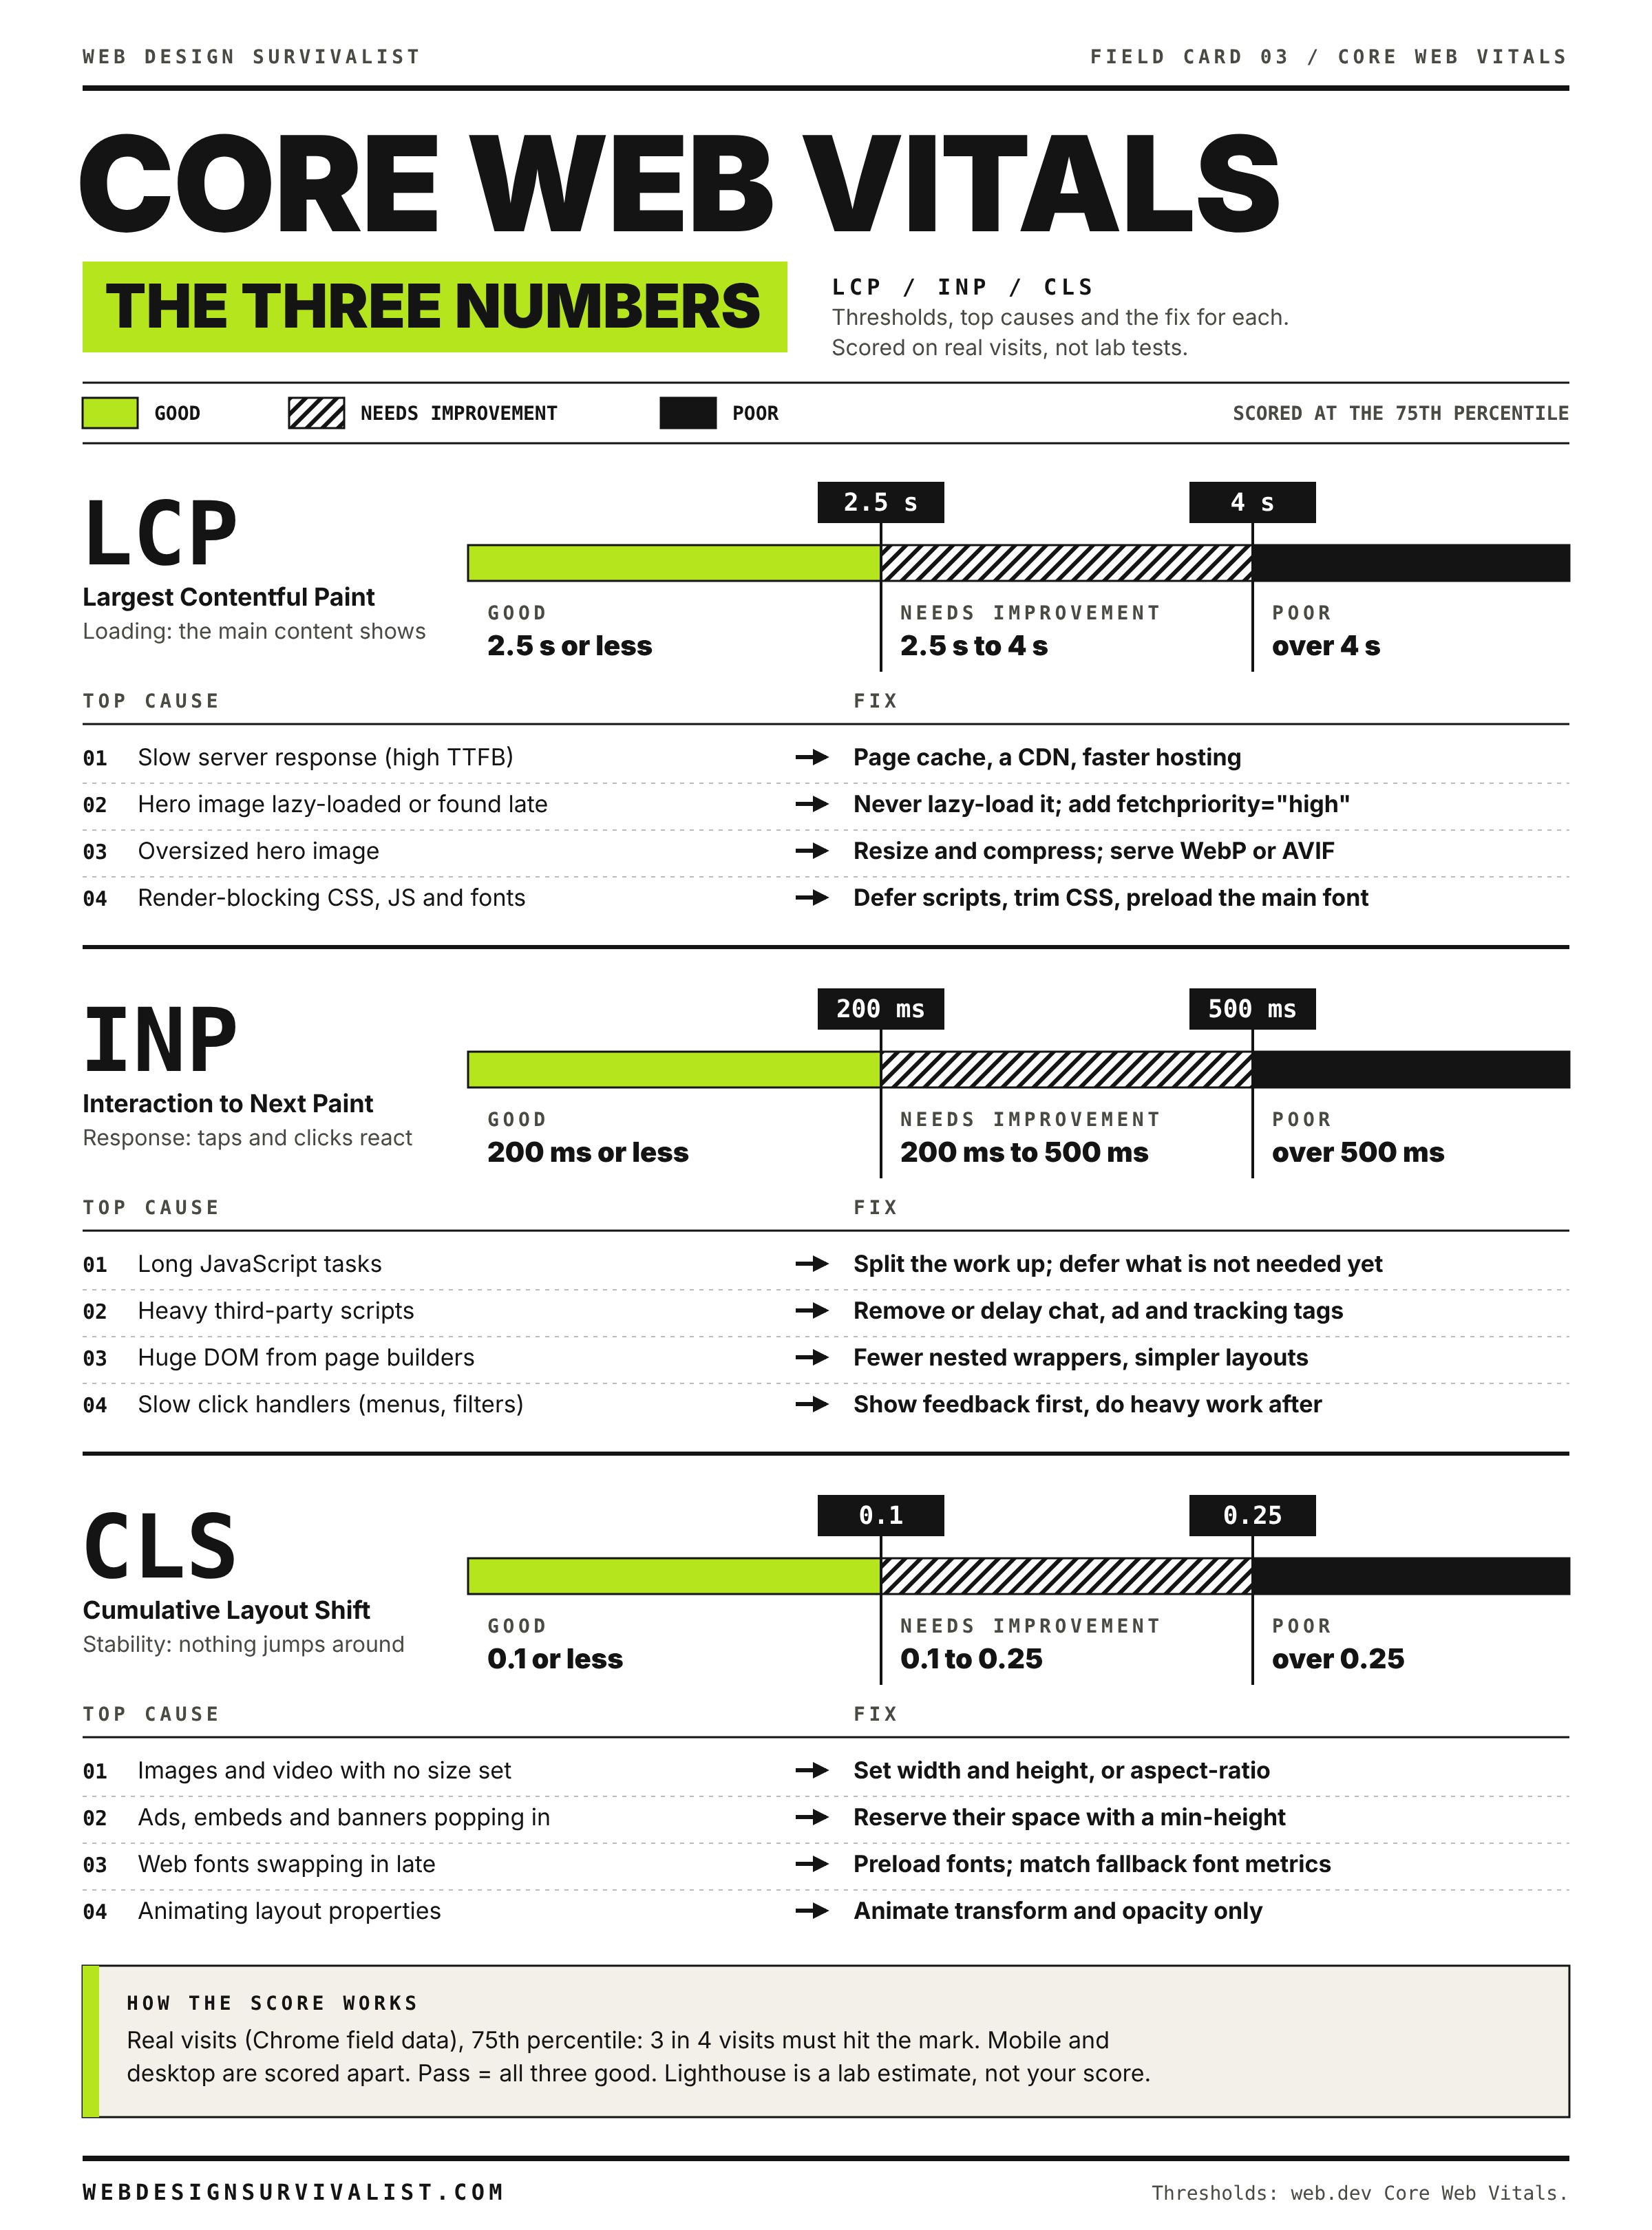
Field card 03: Core Web Vitals: the three numbers. Print it on any black and white printer. All field cards
When to contact your host
If TTFB is the biggest subpart even with page caching turned on, the server is the bottleneck. Send your host:
the URLs and times of tests, in UTC, and the TTFB figures from the curl command above;
whether the cache was a HIT or MISS on those requests (the response headers);
your PHP version and the plugins you have already ruled out;
Content jumps as the page loads and Search Console reports a CLS issue. Find the element that moves and why, then reserve space for images, embeds, ads, fonts and banners.
PageSpeed says the server responds slowly. Measure TTFB with curl, prove whether page cache is working, then find the PHP, query or HTTP call eating the time.
Many slow sites are slow by design. Find the LCP element in PageSpeed Insights, then fix the hero image, trim font files, tame sliders and animations, and stop layout shift.