How to Fix “Reduce Initial Server Response Time” and High TTFB on WordPress
PageSpeed says the server responds slowly. Measure TTFB with curl, prove whether page cache is working, then find the PHP, query or HTTP call eating the time.
PageSpeed Insights or Lighthouse flags “Reduce initial server response time”, or in newer versions the “Document request latency” insight with the message that the server responded slowly. In plain words: your browser asked for the HTML of the page, and the server took too long to send back the first byte. Nothing else on the page (images, CSS, fonts) can start downloading until that HTML arrives, so a slow first byte delays everything.
That delay is called Time to First Byte, or TTFB. On WordPress it almost always comes from one of three places: the page is not being served from cache, PHP is doing too much work to build the page, or the server is waiting on something else (the database, or a remote API). Design weight such as large images, web fonts and animations is a separate problem with its own guide (FG-11), so this guide stays on the server side.
What is happening
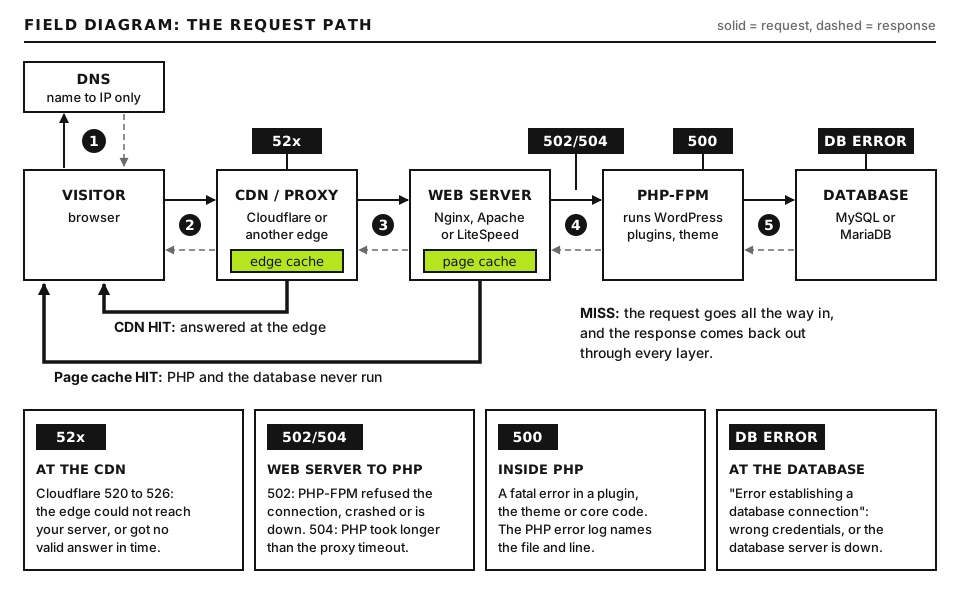
When a request reaches your server, one of two things happens. If a full page cache has a stored copy of that URL, the web server (or a CDN in front of it) sends the stored HTML straight away, often in tens of milliseconds. If there is no usable cached copy, the request is handed to PHP. PHP loads WordPress core, every active plugin and your theme, runs database queries, possibly calls remote services, renders the HTML and only then sends the first byte.
A cache hit returns early. A miss runs PHP and the database, which is where TTFB grows. Open full size
Measure
What it means
Where you see it
TTFB (field)
Time from navigation start to first byte, including redirects, DNS, connection and server time. Google treats 0.8 s or less as good and above 1.8 s as poor.
Time the main document took to start responding in the Lighthouse test. Lighthouse flags it when it goes above 600 ms.
Lighthouse, PageSpeed lab section
Uncached TTFB
How long PHP and the database take to build a page from scratch.
curl against a URL that bypasses cache
Cached TTFB
How fast the cache layer answers. Should be very low.
curl against a normal URL, second request
The key insight: a site can have a perfect cached TTFB and a terrible uncached TTFB. Visitors who hit a cached page never notice, but logged-in users, shoppers with a cart and anyone who arrives with a tracking query string can get the slow path every time.
Before you start
Access: WordPress admin, and ideally SSH or a hosting file manager. Some steps need a terminal on the server.
Backup: nothing in the measuring steps changes your site. Take a backup before switching PHP versions or installing an object cache.
Running commands on the server: connect over SSH and cd into the site folder, the one that contains wp-config.php. WP-CLI is wp on most hosts; some container setups call it wp-cli. Use whichever your host provides.
Running commands on your computer:curl is built into macOS, Linux and current Windows 10 and 11 (open Command Prompt or PowerShell and type curl.exe so PowerShell does not substitute its own alias). WSL also works.
Step 1: Measure TTFB properly with curl
Browser tools mix in your local network and extensions. curl gives you a clean, repeatable number. Run this on your own computer:
Placeholder: replace https://example.com/ with the exact page you are testing, including the trailing slash if your site uses one (a missing slash can add a redirect). On Windows, write NUL instead of /dev/null.
Flags:-o /dev/null throws away the HTML so it does not flood your screen. -s hides the progress bar. -w prints the timing variables after the transfer.
What each timing means. Every value is in seconds and is cumulative from the moment curl started, not a separate duration:
time_namelookup: DNS lookup finished. Above about 0.1 s on repeat runs points at slow DNS.
time_connect: TCP connection to the server is open. The gap from DNS to connect is roughly one network round trip.
time_appconnect: TLS handshake finished. On plain HTTP this stays at zero.
time_pretransfer: curl is ready to send the request.
time_redirect: time spent on redirects. It is zero unless you add -L; if it is not zero, fix the redirect chain first.
time_starttransfer: the first byte of the response arrived. This is your TTFB.
time_total: the whole response downloaded.
The number to watch is ttfb minus pretransfer. That gap is almost entirely the server thinking. Network setup should be a small slice.
Good output: pretransfer around 0.05 to 0.2 s and ttfb only slightly higher, for example 0.15 s. Bad output: pretransfer 0.1 s and ttfb 1.9 s means the server spent about 1.8 s building the page. Run it three times. If the first run is slow and the next two are fast, the cache is warming and working. If all three are slow, the cache is not serving that URL.
Placeholder:RANDOM_STRING is any text you have not used before, such as the current time. Many caches treat unknown query strings as a new page, so this usually forces PHP to build it. Some caches ignore certain parameters; if the time is still very low, the cache is ignoring the string, so try a different parameter name.
Reading it: this is your uncached TTFB. Under about 0.5 s is healthy for a typical WordPress site. Between 1 and 3 s means PHP work needs attention (Steps 3 to 6). Above that, something is waiting or failing.
Step 2: Prove whether the page cache is serving you
Flags:-I sends a HEAD request and prints headers only. grep -iE filters to cache-related headers, case insensitive. Some setups answer HEAD differently from GET; if the results look odd, use curl -s -D - -o /dev/null URL instead, which does a normal GET and prints the headers.
Header
Set by
Values to look for
x-litespeed-cache
LiteSpeed web server with LiteSpeed Cache
hit is good. miss on the second request means it is not caching that URL.
cf-cache-status
Cloudflare
HIT served from the edge. DYNAMIC means Cloudflare is not caching the HTML at all, which is its default for HTML. BYPASS means a rule or cookie told it to skip.
x-cache
Varnish, Nginx setups, many CDNs
HIT or MISS, sometimes with a server name.
age
Shared caches
Seconds the copy has been stored. A rising number on repeat requests confirms caching.
cache-control
WordPress, plugins
no-cache, must-revalidate, max-age=0 or private on a public page tells caches not to store it.
Plugin caches that write static HTML files (WP Super Cache, WP Rocket, W3 Total Cache and others) often add an HTML comment at the very bottom of the page instead of a header. View the page source in a logged-out private window and scroll to the end.
Step 3: Find out why the cache is being bypassed
If you see MISS or BYPASS every time, something is telling the cache to step aside. These are the usual reasons, from most to least common.
Cookies
Page caches skip anyone carrying WordPress session cookies, because the page might be personalized. The important ones are wordpress_logged_in_*, wp-postpass_* (password-protected posts), comment_author_* (anyone who commented), and WooCommerce cookies such as woocommerce_items_in_cart, woocommerce_cart_hash and wp_woocommerce_session_*. This is correct behavior, but it means logged-in users and shoppers always get uncached TTFB, so your uncached number matters.
To confirm, open devtools (F12), go to Application, then Cookies, and look at what is set for your domain. Then check whether a plugin sets a cookie for every visitor on every page. A plugin that starts a WooCommerce session or a PHP session for all visitors can make nearly every request uncacheable. Test from curl, which sends no cookies: if curl gets HIT and your browser gets MISS, a cookie is the reason.
Query strings
Ad clicks add ?gclid=, ?fbclid= or utm_ parameters, and many caches treat each unique string as a new page. Most cache plugins and Cloudflare cache rules can ignore known marketing parameters. Look for a setting named along the lines of “drop query strings” or “ignore query strings” in your cache plugin.
Excluded pages and WooCommerce
Cart, checkout and My Account pages must never be cached, and good cache plugins exclude them automatically. That is expected. The problem is when the exclusion is too broad, for example a rule that excludes every URL containing /shop.
Headers that forbid caching
If cache-control: no-cache or private appears on public pages, a plugin is calling nocache_headers() or starting a PHP session. Deactivate plugins one at a time on a staging copy and re-run the header check to find it.
Step 4: PHP version and OPcache
Newer PHP releases run WordPress noticeably faster than old ones, and OPcache keeps compiled PHP in memory so the server does not re-read and re-compile thousands of files on every request. Without OPcache, uncached TTFB is often several times higher.
Check your PHP version in WordPress at Tools, Site Health, Info, Server. PHP 8.1 and older are past their end of life. Pick the newest version your theme and plugins support; check wordpress.org/about/requirements for the current recommendation. Change it in your hosting panel, test on staging first, and keep the old version noted so you can switch back.
To check OPcache for the web server (not the command line, which often has its own settings), create a temporary file named oc-check-RANDOM_STRING.php in the site folder:
Placeholder:RANDOM_STRING is any random text, so nobody can guess the file name. Visit https://example.com/oc-check-RANDOM_STRING.php in your browser, read the result, then delete the file.
Good output: enabled yes, some free memory, hit rate above 99. Bad output: “OPcache is OFF”, free memory near zero (the cache is full and evicting scripts), or a low hit rate. The relevant directives are opcache.enable=1, opcache.memory_consumption (default 128 MB; busy sites with many plugins may need 256) and opcache.max_accelerated_files (default 10000; plugin-heavy sites can exceed it). On managed hosting you may need to open a ticket to change them.
Step 5: Profile the slow page with Query Monitor
Install the free Query Monitor plugin. Load the slow page while logged in as an administrator and open the Query Monitor menu in the admin bar. Logged-in pages bypass cache, which is exactly what you want here.
Overview: total page generation time, peak memory, database query time and count. If generation time is high but query time is a small part of it, the cost is PHP work or HTTP calls, not the database.
Queries by Component: groups queries by plugin, theme and core. This is usually the fastest way to name the guilty plugin.
Slow Queries: appears when any query exceeds the threshold, 0.05 s by default (you can change it with the QM_DB_EXPENSIVE constant in wp-config.php). Each row shows the SQL, the calling function and the component. A query that takes 0.8 s on every page load is a clear target.
Duplicate Queries: the same query run many times, typically a plugin looking something up inside a loop.
HTTP API Calls: every outbound request WordPress made while building the page, with the URL, the response and the time taken.
Database-level problems such as a huge autoloaded options payload or a missing index are covered in depth in the database bloat guide (FG-34). Here, focus on naming the component.
Step 6: Time each stage and hook with wp profile
The wp profile command breaks a page load into stages and hooks, from the command line, without a browser. It is a separate package. On the server, in the site folder:
Placeholder:PAGE_PATH is the slow page path, for example shop. Leave --url off to profile the home page. If package installation is blocked on your host, ask them; some managed hosts preinstall it.
Reading the output: it prints three stages: bootstrap (loading WordPress, plugins and theme), main_query (working out which content to show) and template (rendering). Columns include time, query_time, query_count, cache_ratio and hook_time. A bootstrap stage of 1.5 s means plugins are doing heavy work on every request before WordPress even knows what page it is on.
Flags: giving a stage name lists the hooks inside it. --spotlight hides rows with near-zero values so the expensive ones stand out. wp profile hook HOOK_NAME lists every callback attached to that hook with its time, which names the exact function. Add --orderby=time --order=DESC to sort the worst to the top. Good output: no single callback above a few tens of milliseconds. Bad output: one callback such as Some_Plugin->load_settings() taking 0.6 s on init.
Step 7: External HTTP calls during page load
A plugin that calls a remote API while building every page (license checks, social share counts, currency rates, font services, analytics servers) adds that remote server’s response time to your TTFB. If the remote service is slow or down, your page waits for the timeout, often 5 seconds or more.
Confirm it in Query Monitor’s HTTP API Calls panel. To prove it from the server side, temporarily block outbound requests in wp-config.php on a staging copy:
Add these lines above the line that says to stop editing. WP_HTTP_BLOCK_EXTERNAL stops the WordPress HTTP API from reaching any outside host; WP_ACCESSIBLE_HOSTS is a comma separated allow list. If uncached TTFB drops sharply, an external call is your cause. Remove the lines afterward, then fix the plugin: look for a setting to cache the result, move the call to a scheduled task, or replace the plugin.
Step 8: Add a persistent object cache, when it actually helps
WordPress has an object cache that only lives for one request by default. A persistent object cache (Redis or Memcached, via a drop-in file at wp-content/object-cache.php) keeps query results and options between requests. Site Health suggests one on larger sites.
wp cache type
Run this on the server. Output:Default means no persistent cache. Redis or Memcached means a drop-in is active.
It helps most where pages cannot be page-cached: WooCommerce carts, membership sites, busy wp-admin, and sites with heavy repeated queries. It helps little on a small brochure site where almost every visitor gets a cached page. It can also hurt: a remote Redis server with high latency, or a full Redis instance evicting keys, can be slower than no object cache. If the profile shows a cache_ratio near 100 percent but times did not improve, the bottleneck is elsewhere.
Advanced: Separating network time from server time
For a precise picture, combine curl timings with the server’s own view. Add Server-Timing headers, or read the PHP-FPM slow log if your host exposes it. The slow log records a stack trace of any request that runs longer than request_slowlog_timeout (for example 5s), configured in the FPM pool file:
Placeholder:SITE_NAME is your pool or site name; the real path depends on your server. This lives in the FPM pool configuration, which usually only the host or a VPS owner can edit. Reading a trace: the lowest lines show how the request started (index.php), and the top lines show the function it was stuck in when the timeout hit. If the top line is curl_exec(), PHP was waiting on a remote server. If it is mysqli_query(), it was waiting on the database.
Also compare TTFB from different locations. If curl from a machine near the server shows 0.2 s but your users far away see 1.2 s, the gap is distance, not PHP. A CDN that caches HTML at the edge (Cloudflare cache rules or APO, for example) fixes that; tuning PHP does not.
Finally, watch for PHP worker saturation. If uncached TTFB is fine at quiet times but jumps during traffic peaks, requests may be queueing for a free PHP worker. That problem, and the “server reached pm.max_children” log line, is a capacity issue covered with the 502 and 503 errors.
When to contact your host
Open a ticket if uncached TTFB stays high after you have ruled out plugins, or if you cannot change PHP or OPcache settings yourself. Send:
The exact URLs tested, with curl output for both cached and uncached runs, and the time of each test in UTC.
The cache headers you saw (x-litespeed-cache, cf-cache-status with the cf-ray ID, x-cache).
Your PHP version and the OPcache check results.
The wp profile stage output and any Query Monitor slow queries or HTTP calls.
What changed recently: plugin installs, a PHP switch, a traffic spike, a migration.
For a quick outside check of headers and response times you can also use the tools at our diagnostic tools page. If the site is not just slow but timing out completely, go to the Emergency Room.
Did this fix it?
Still stuck? Start again from what you can see in the Emergency Room.
Still stuck?
Print a free one-page checklist to keep, or open the Emergency Room if the symptom does not match.
A bloated database slows every uncached page. Measure autoloaded options, transients, revisions and orphaned meta with exact SQL, then clean up safely after a backup.
CPU pegged and pages crawling, but no real traffic spike? Read your access logs to find the bots, verify fake Googlebots, and rate limit or block them at the right layer.
Search Console or PageSpeed Insights says your LCP is too slow. Find the LCP element, see which of its four parts is slow, and fix the hero image, server time or render blocking.