How to Fix “503 Service Unavailable” and “508 Resource Limit Is Reached”
Your account or server ran out of PHP workers, processes or CPU. Find which limit was hit, find the URLs and bots eating it, then cache, block or upgrade.
Visitors see 503 Service Unavailable, sometimes with “The server is temporarily unable to service your request due to maintenance downtime or capacity problems”, or 508 Resource Limit Is Reached with “The website is temporarily unable to service your request as it exceeded resource limit. Please try again later.” The site often works for a while, fails, then recovers on its own.
Both errors usually mean the same thing: your account asked for more of the server than it is allowed to use at once. A 508 is the specific code CloudLinux based shared hosting returns when an account hits its limits. A 503 is broader: a proxy or web server could not hand the request to PHP because no worker was free, a rate limit fired, or PHP-FPM was unreachable. Busy stores, sites under bot attack and sites with no page cache see these most.
What is happening
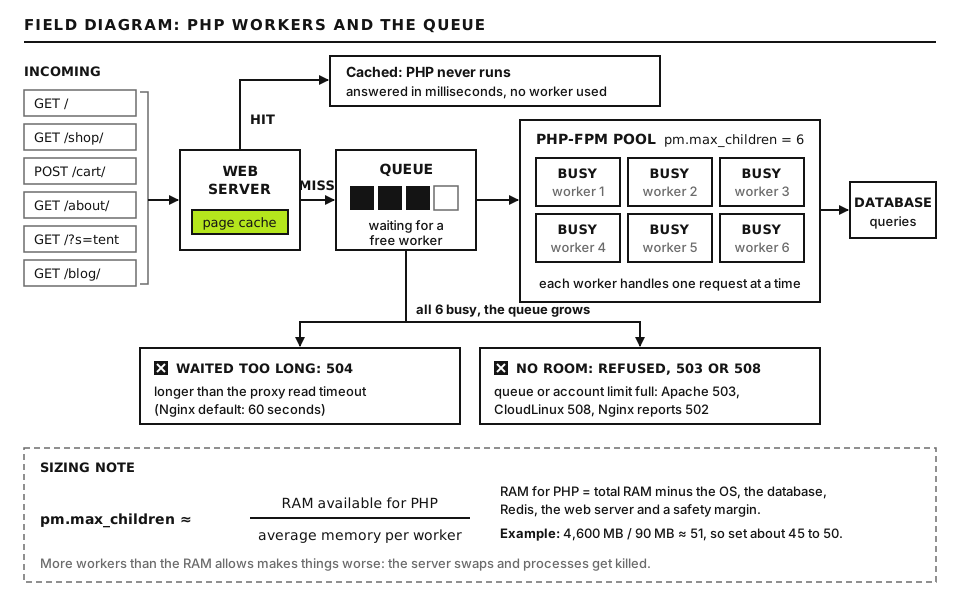
Every PHP page view needs a PHP process for as long as it takes to build the page. Shared and many managed hosts cap how many of those can run at once and how much CPU, memory and disk I/O your account may use. CloudLinux, used on a lot of shared hosting, wraps each account in a “lightweight virtual environment” (LVE) with limits like these:
Cached pages skip PHP. Everything else waits for a free worker, or fails. Open full size
Limit
What it caps
What you see when it is hit
EP (entry processes)
Concurrent requests entering your account’s PHP, roughly simultaneous page builds
508 Resource Limit Is Reached
NPROC
Total processes and threads in the account, including cron, SSH and mail
500 or 508 errors, cron jobs failing to start
SPEED (CPU)
CPU as a percentage of one core
The site slows down; requests take longer and pile up into EP faults
PMEM (physical memory)
RAM used by all your processes together
500, 503 or 508 errors, PHP processes killed
IO and IOPS
Disk throughput and disk operations per second
Slowness while the account is throttled
Outside CloudLinux, the same idea applies with different names. On a server running Nginx and PHP-FPM, the cap is pm.max_children in the PHP-FPM pool. Apache with PHP-FPM returns 503 when it cannot connect to the back end, and Nginx’s limit_req rate limiting returns 503 by default when a client exceeds the rate.
The key insight: limits are hit when requests are slow, frequent or both. Ten slow requests a second can exhaust what a hundred fast ones would not.
Before you start
Access you need: your hosting panel (for resource graphs and raw access logs), SSH if available, and access to your CDN or firewall if you use one.
Backups: copy .htaccess before adding blocking rules, and note any setting before you change it.
How to run commands: server commands run in an SSH terminal, in the site folder (the one with wp-config.php) unless stated. WP-CLI is wp on most hosts and wp-cli on some. curl runs on your own computer: built into macOS and Linux, and available on Windows as curl.exe in PowerShell or through WSL.
Step 1: Rule out WordPress maintenance mode
WordPress returns a 503 with the message “Briefly unavailable for scheduled maintenance. Check back in a minute.” while it updates. If an update is interrupted, the .maintenance file it creates stays behind and the site stays in that state.
ls -la .maintenance
rm .maintenance
Run these over SSH in the site folder. The first line confirms the file exists; “No such file or directory” means this is not your cause. The second removes it. In a file manager, enable hidden files to see it. After removing it, check in wp-admin, Updates, that the interrupted update actually finished, and rerun it if not. If your 503 page looks different from that message, move on.
Step 2: Find which limit you are hitting
In the panel
On cPanel servers with CloudLinux, open Resource Usage (under Metrics). It shows whether your account was limited in the last 24 hours, graphs for each limit and a count of “faults”, which is the number of times a request was refused or throttled. Other panels show similar graphs under names like “Resource usage”, “Metrics” or “Statistics”. Match the fault spikes to the times visitors saw errors.
EP faults: too many simultaneous PHP requests. Usually traffic spikes, bots, or slow pages that hold processes open.
CPU at the limit with EP faults: requests are slow because they are CPU heavy, so they overlap more. Fix the slowness and EP faults often drop with it.
PMEM faults: one or more processes use too much memory, often an import, image processing or a memory hungry plugin.
NPROC faults: look for runaway cron jobs or many overlapping wp-cron.php runs.
Run this on the server over SSH. PHPFPM_LOG_FILE is your PHP-FPM log, often php8.3-fpm.log on Debian and Ubuntu (the version will match yours). Good output is nothing. Bad output is repeated lines like server reached pm.max_children setting (N), consider raising it, with timestamps that match the errors. That confirms worker exhaustion.
Step 3: Find the culprit in the access log
Traffic is rarely spread evenly. Usually a single bot, one attacking IP range or one expensive URL is responsible. The raw access log shows it.
Where the access log is
On cPanel, use Metrics, Raw Access to download it, or over SSH look in ~/access-logs/. On a VPS, Nginx writes to /var/log/nginx/access.log and Apache to /var/log/apache2/access.log or /var/log/httpd/access_log. Managed hosts usually offer a log download in the site dashboard.
Every command below assumes the standard “combined” log format, where each line looks like this example:
This is example output. Split on spaces, field 1 is the client IP, field 4 the time, field 6 the method, field 7 the URL and field 9 the status code. Split on double quotes, field 6 is the user agent.
Run these over SSH, or on your own computer after downloading the log. ACCESS_LOG is the path to the log file. awk '{print $1}' prints the IP from each line; sort | uniq -c counts identical lines; sort -rn sorts by that count, highest first; head -20 keeps the top twenty. -F'"' tells awk to split on double quotes, so $6 becomes the user agent. Good output shows a fairly flat spread of counts. Bad output shows one IP, URL or user agent with far more hits than the rest.
DD/Mon/YYYY:HH:MM is the minute you saw errors, in the log’s format and time zone, for example 07/Nov/2026:14:05. Shorten it to DD/Mon/YYYY:HH for a whole hour. This counts IP, method and URL combinations in that window. A line with hundreds of identical POSTs to /wp-login.php or /xmlrpc.php in one minute is an attack. Many requests to /?s= search URLs or endlessly varied filter URLs (?filter_color=, ?orderby=) from a crawler is a bot bypassing your cache.
Common patterns and what they mean
Pattern
Meaning
POST /xmlrpc.php or /wp-login.php from many IPs
Brute force login attack
Thousands of /?s=RANDOM or faceted filter URLs
A crawler exploring uncacheable URLs
/wp-admin/admin-ajax.php very frequent
A plugin or the Heartbeat API polling from open admin tabs, or a front end feature calling AJAX on every page
/wp-cron.php on almost every request
WP-Cron triggered by traffic; move it to a real cron job
One user agent such as an SEO tool crawler hitting everything
An aggressive crawler you can rate limit or block
Before blocking a crawler by name, check that it is real. A request claiming to be Googlebot can be verified with a reverse DNS lookup: host IP_ADDRESS should return a name under googlebot.com or google.com, and a forward lookup of that name should return the same IP. Fakes fail this test and can be blocked safely.
Step 4: Reduce PHP hits with caching
A cached page is served as a stored file and never starts PHP, so it never counts against EP or PHP-FPM workers. This is the single biggest fix for most 508 errors.
Page cache: use your host’s server cache or a page cache plugin (for example LiteSpeed Cache on LiteSpeed servers, or WP Super Cache, W3 Total Cache or WP Rocket elsewhere). Make sure logged-out visitors get cached pages.
Check it works: load a page in a private window and inspect the response headers for a cache hit header such as x-litespeed-cache: hit, x-cache: HIT or cf-cache-status: HIT.
Object cache: Redis or Memcached, if your host offers it, cuts database work on pages that cannot be page cached, such as cart and account pages.
CDN: offloads images, CSS and JavaScript, and with full page caching rules can serve whole pages from the edge.
Heartbeat: each open wp-admin tab polls admin-ajax.php. Close idle editor tabs, or slow Heartbeat with a performance plugin setting.
Real cron: add define( 'DISABLE_WP_CRON', true ); to wp-config.php and run wp cron event run --due-now from the panel’s cron jobs page every five or ten minutes.
Run this on your computer twice in a row. Replace example.com with your domain. -D - prints the response headers, -o /dev/null discards the page, and the grep keeps cache related headers. Good output on the second run shows a HIT or a non zero age. A MISS every time, or a cache-control: no-cache or set-cookie header on a public page, means the cache is bypassed and every visit runs PHP.
Step 5: Block abusive bots and attacks
At the edge (best)
Blocking at a CDN or firewall stops the request before it reaches your account, so it costs you nothing. In Cloudflare, use WAF custom rules to block or challenge by path, IP, country or user agent, and rate limiting rules to cap requests to /wp-login.php and /xmlrpc.php. Cloudflare’s bot settings can also challenge known bad bots. Sucuri and similar services offer comparable controls.
In .htaccess (Apache and LiteSpeed)
<Files xmlrpc.php>
Require all denied
</Files>

<IfModule mod_rewrite.c>
RewriteEngine On
RewriteCond %{HTTP_USER_AGENT} (BOT_NAME_ONE|BOT_NAME_TWO) [NC]
RewriteRule .* - [F,L]
</IfModule>
Add this to the top of .htaccess in the site folder, above the WordPress block. The first block denies all access to xmlrpc.php; skip it if you use the Jetpack plugin or a mobile app that needs XML-RPC. BOT_NAME_ONE and BOT_NAME_TWO are distinctive parts of the user agents you found in Step 3; separate more names with |. [NC] makes the match case insensitive and [F,L] returns 403 Forbidden and stops processing. Test that the site still loads, then check the access log: blocked bots now get status 403, which is cheap for the server. A 500 after adding this means a syntax error; restore your backup.
In WordPress
A security plugin such as Wordfence can rate limit crawlers and block IPs, but it runs inside PHP, so each blocked request still uses a PHP process. Use it for visibility and fine-grained rules, and do the heavy blocking at the edge or server.
A Crawl-delay line in robots.txt is honored by some crawlers but ignored by Google, and bad bots ignore robots.txt entirely. Do not rely on it.
Step 6: Find and fix slow pages
If faults happen at normal traffic levels, your pages are too slow, not too popular. Use Query Monitor on a staging copy to find the slowest database queries and remote HTTP calls by plugin. Watch for searches and filters on large WooCommerce catalogs, related posts plugins running heavy queries, and plugins that call external APIs on every page view. Our 502 and 504 guide covers tracing a slow request in detail.
Step 7: Know when you need a bigger plan
After caching and blocking, look at the resource graphs again over a normal week. Upgrade, or move to a VPS or managed plan with more PHP workers, when:
EP or worker limits are hit by real, logged-in or uncacheable traffic: shoppers in cart and checkout, members, LMS students.
CPU sits near the limit during ordinary business hours with caching working.
Memory faults come from legitimate tasks you cannot shrink, such as large imports or image processing.
You have planned peaks: a product launch, a TV mention or a big email campaign.
Upgrading does not fix a bot flood or a missing cache; it just raises the ceiling the problem will hit next.
Advanced: Sizing pm.max_children
On a VPS or dedicated server running PHP-FPM, the number of workers is your concurrency limit. Too low and visitors get 502 or 503 under load; too high and the server runs out of RAM, starts swapping, and the out of memory killer stops processes, which is worse.
The formula
pm.max_children = RAM available for PHP / average memory per PHP-FPM worker
“RAM available for PHP” is total RAM minus what everything else needs: the operating system, MySQL or MariaDB (look at its buffer pool size), Redis, Nginx or Apache, and a safety margin.
Measure the average worker size
ps --no-headers -o rss -C PHPFPM_PROCESS_NAME | awk '{sum+=$1; n++} END {if (n) printf "%d workers, average %.0f MB\n", n, sum/n/1024}'
Run this on the server over SSH, ideally during normal traffic so workers have loaded typical pages. PHPFPM_PROCESS_NAME is the process name, such as php-fpm8.3 or php-fpm; check with ps aux | grep fpm. -o rss prints each process’s resident memory in kilobytes and -C selects processes by name. The awk script averages them and converts to megabytes. The master process is included and is smaller, which slightly lowers the average, so round up. WooCommerce and page builder sites commonly show larger workers than simple blogs.
Worked example
Say a server has 8 GB of RAM. You reserve 1 GB for the operating system, 2 GB for MariaDB and 0.5 GB for Redis and Nginx, leaving 4.5 GB, about 4,600 MB, for PHP. If the average worker uses 90 MB, then 4,600 / 90 is about 51. Set pm.max_children to around 45 to 50 to leave headroom. These are illustration numbers; use your own measurements.
Related pool settings
pm = dynamic keeps between pm.min_spare_servers and pm.max_spare_servers idle workers ready. pm = ondemand starts workers only when needed, which saves RAM on low traffic sites. pm = static keeps all workers running all the time, which is predictable on dedicated servers.
pm.max_requests recycles each worker after that many requests, which contains slow memory leaks in plugins. A value in the hundreds is a common choice.
Check CPU too. Workers beyond what your CPU cores can actually run in parallel just queue for CPU time; more workers do not make slow PHP faster.
After changing the pool file, test with the FPM config test (for example sudo php-fpm8.3 -t), restart PHP-FPM, and watch free -m and the FPM status page under load.
When to contact your host
Open a ticket if you cannot see resource graphs or raw logs, if faults continue after caching and blocking, or if you want to know whether a plan change would help. Send:
UTC timestamps of the errors, and which code you saw (503 or 508).
A screenshot or export of the resource usage graphs showing which limit faulted.
Your top IPs, URLs and user agents from the access log for the outage window.
What you have already done: caching enabled and confirmed, bots blocked, cron moved.
Any planned traffic peaks, so the host can suggest the right plan.
The web server hit something it could not handle and gave up. Read the error log, test .htaccess, then check permissions, the PHP handler and security rules, in that order.
Cloudflare is up, but it could not get a good answer from your server. Each code names a different failure. Test the origin directly, then fix firewall, SSL or timeout.