You see 502 Bad Gateway or 504 Gateway Timeout, often with nginx printed underneath. Other versions include “Error 503 Backend fetch failed” from Varnish, “502 Bad Gateway: The proxy server received an invalid response from an upstream server” from Apache, or a branded page from your host’s load balancer.
Both errors come from a proxy: a server whose job is to pass your request to another server and relay the answer. A 502 means the proxy reached the back end and got a broken answer, or could not connect at all. A 504 means it waited and no answer came in time. On WordPress the back end is almost always PHP-FPM, so these errors usually mean PHP crashed, ran out of workers or took too long.
What is happening
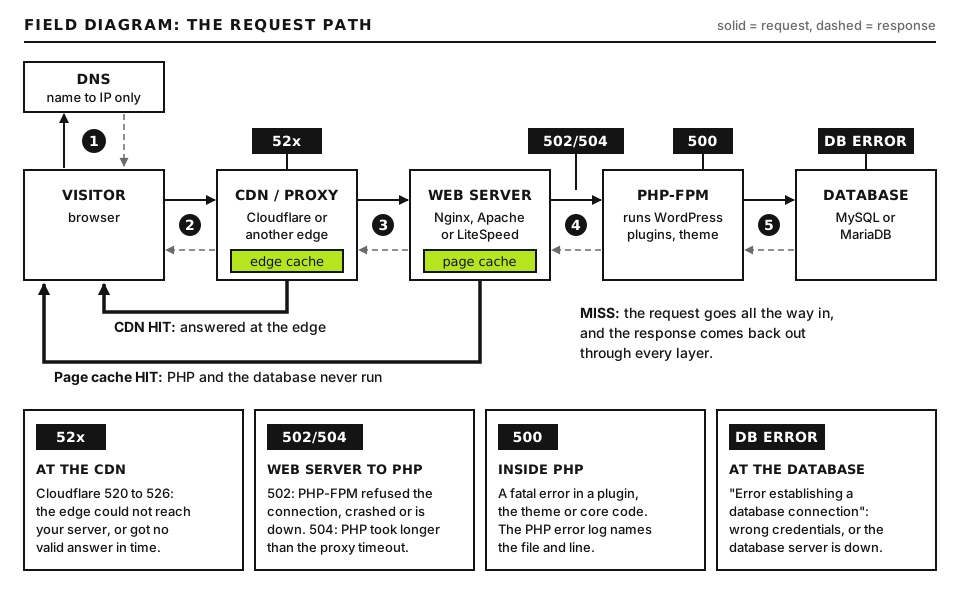
Most modern WordPress hosting splits the work. Nginx (or Apache with mod_proxy_fcgi, or LiteSpeed) accepts the connection, serves images and CSS itself, and forwards PHP requests to PHP-FPM over a Unix socket or a TCP port. PHP-FPM keeps a pool of worker processes; each worker handles one request at a time. There may be more layers in front: a CDN, Varnish, or a load balancer.
502 and 504 are produced between the web server and PHP-FPM. Open full size
Code
What the proxy experienced
Common WordPress causes
502
Connection refused, socket missing, or the back end closed the connection without a valid response
PHP-FPM stopped or restarting, worker crashed (segfault, out of memory killer), wrong socket path, all workers busy with a full queue
504
Connected, sent the request, and waited longer than its read timeout
Slow plugin code, slow database queries, a remote API that never answers, an import or backup running in a web request
Every layer has its own timeout, and the shortest one wins. If Cloudflare is in front, it shows its own 5xx codes instead; those are covered in our Cloudflare errors guide.
Before you start
Access you need: your hosting panel’s log viewer at minimum. On a VPS you need SSH with sudo to read /var/log/nginx/ and restart PHP-FPM. On managed hosting, the host controls PHP-FPM and timeouts; your job is to collect evidence and fix slow code.
Backups: take a copy of any config file before editing it, for example sudo cp FILE FILE.bak.
How to run commands: server commands run in an SSH terminal. WordPress commands run from the site folder (the one containing wp-config.php) using wp, or wp-cli on some hosts. curl runs on your own computer: built in on macOS and Linux, and available on Windows as curl.exe in PowerShell or inside WSL.
Step 1: Read the upstream error in the log
The proxy’s error log names the failure precisely, so start there.
Run this on the server over SSH. The path is the Nginx default; per-site setups may use /var/log/nginx/DOMAIN_NAME.error.log, where DOMAIN_NAME is your site. tail -n 100 shows the last 100 lines and grep -i upstream keeps only lines mentioning the upstream (the back end), ignoring case. No output means the failure is not at this Nginx; look at the layer in front of it.
What each message means
Log text
Status
Meaning
connect() to unix:/run/php/php8.3-fpm.sock failed (2: No such file or directory)
502
PHP-FPM is not running, or Nginx points at the wrong socket (common after a PHP version change)
The socket’s listen queue is full: every worker is busy and the backlog overflowed
connect() ... failed (13: Permission denied)
502
The socket’s owner or mode does not let the Nginx user connect
upstream prematurely closed connection while reading response header from upstream
502
A worker died mid request: a crash, the out of memory killer, or PHP-FPM’s request_terminate_timeout
recv() failed (104: Connection reset by peer)
502
Same family: the back end dropped the connection
upstream sent too big header while reading response header from upstream
502
The response headers (often many cookies) exceed fastcgi_buffer_size
upstream timed out (110: Connection timed out) while reading response header from upstream
504
PHP took longer than fastcgi_read_timeout (or proxy_read_timeout)
The socket path above is example output; yours will show your PHP version. Each line also includes client: (visitor IP), request: (method and URL) and upstream: (where Nginx tried to send it). The request: field is how you find the slow URL.
On Apache with PHP-FPM, look for AH01067: Failed to read FastCGI header (the 502 equivalent) or The timeout specified has expired together with AH01075: Error dispatching request (the 504 equivalent) in the Apache error log.
Step 2: Check whether PHP-FPM is running and has free workers
If every PHP page fails while images still load, PHP-FPM is the suspect.
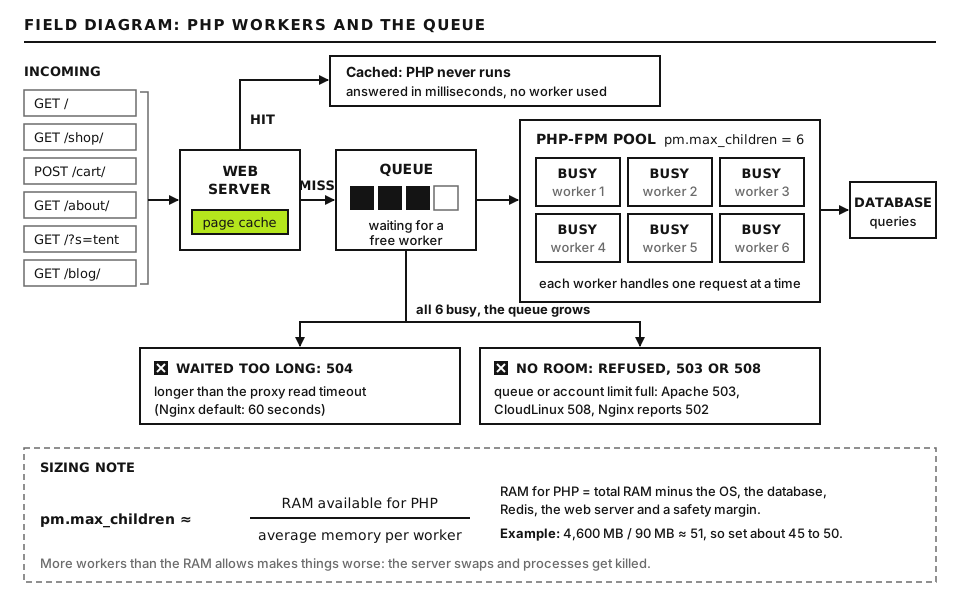
When every worker is busy, requests queue until they time out or are refused. Open full size
Confirm it
systemctl status PHPFPM_SERVICE
sudo tail -n 50 /var/log/PHPFPM_LOG_FILE
Run these on the server over SSH. PHPFPM_SERVICE is the service name, such as php8.3-fpm on Debian and Ubuntu or php-fpm on RHEL family systems; systemctl list-units | grep fpm lists it. PHPFPM_LOG_FILE is the FPM log, often php8.3-fpm.log or php-fpm/error.log. Good output says active (running). Bad output says failed or inactive, or the log contains lines like these:
WARNING: [pool www] server reached pm.max_children setting (10), consider raising it
WARNING: [pool www] child 48211 exited on signal 11 (SIGSEGV) after 3.502011 seconds from start
WARNING: [pool www] child 48302, script '/var/www/html/index.php' (request: "POST /wp-admin/admin-ajax.php") execution timed out (120.004521 sec), terminating
This is example log output. The first line means every worker was busy and new requests had to queue: the classic cause of intermittent 502s under load. The second is a crash, often a buggy PHP extension or opcache problem. The third means FPM killed a request that ran past request_terminate_timeout, which Nginx reports as “upstream prematurely closed”. The script and request fields name the culprit.
Fix it
Service stopped:sudo systemctl restart PHPFPM_SERVICE. If it will not start, run the FPM binary’s config test (for example sudo php-fpm8.3 -t) and read the error.
Wrong socket after a PHP upgrade: make fastcgi_pass in the Nginx site config match the listen line in the pool file, test with sudo nginx -t, then sudo systemctl reload nginx.
max_children reached: either the pool is too small for real traffic, or workers are stuck on slow requests. Raising the limit without enough RAM makes things worse; see the Advanced section and our 503 and 508 guide for sizing.
Out of memory kills: run sudo dmesg -T | grep -i -E 'killed process|out of memory'. Lines naming php-fpm mean the server ran out of RAM.
Step 3: Understand the three timeouts
504s, and some 502s, come from timeouts that do not agree with each other. Here are the ones that matter.
Setting
Where
Default
What happens when it fires
max_execution_time
php.ini, .user.ini or panel
30 seconds (0, unlimited, for CLI)
PHP stops the script with a fatal “Maximum execution time exceeded”
request_terminate_timeout
PHP-FPM pool file
0 (off)
FPM kills the worker. Nginx logs “prematurely closed”, visitor sees 502
fastcgi_read_timeout
Nginx, for PHP-FPM
60 seconds
Nginx gives up waiting for PHP and returns 504
proxy_read_timeout
Nginx, when proxying to another HTTP server
60 seconds
Same as above, for proxied setups
ProxyTimeout / Timeout
Apache
60 seconds
Apache returns 504
Two traps catch people. First, on Linux max_execution_time counts only time the script itself spends executing; time waiting on database queries, remote HTTP calls and sleep() does not count. A script can therefore sit for minutes waiting on a slow API while PHP thinks it has used only a few seconds, and the proxy times out first. Second, many WordPress plugins call set_time_limit() to raise their own limit, which does not change any proxy timeout.
The healthy pattern is: PHP’s own limit fires first (a clear error in the PHP log), then FPM’s terminate timeout as a safety net, then the proxy. For example, max_execution_time = 60, request_terminate_timeout = 90s and fastcgi_read_timeout 120s. Raise these only as far as you genuinely need: long timeouts let stuck requests hold workers longer.
This is an Nginx config file you edit on a VPS, usually in /etc/nginx/sites-available/ or /etc/nginx/conf.d/. PHPFPM_SOCKET is the socket named in your pool’s listen line. Only the fastcgi_read_timeout line is new; leave the rest of your existing block alone. Run sudo nginx -t; good output ends with test is successful. Then reload with sudo systemctl reload nginx.
Step 4: Find the slow request
Raising timeouts treats the symptom. The real fix is to find which URL is slow and why.
Run this on the server. It assumes the standard “combined” log format, where field 4 is the time, field 7 the URL and field 9 the status code. $9 == 502 || $9 == 504 keeps only failed requests. Good output is a short list where one or two URLs repeat, for example /wp-admin/admin-ajax.php, /wp-cron.php, /?wc-ajax=checkout or a REST route such as /wp-json/PLUGIN_NAMESPACE/. If every URL appears, the problem is PHP-FPM capacity, not one slow page.
Common slow requests in WordPress
admin-ajax.php POSTs: page builders, live search, stats plugins. The POST body names the action; Query Monitor or the browser’s Network tab shows it.
wp-cron.php: scheduled jobs piling up. List them with wp cron event list in the site folder.
Imports and exports: WooCommerce product CSV imports, WP All Import, migration and backup plugins processing everything in one request.
Remote calls: license checks, social feeds or payment gateways that hang when the remote service is slow.
Heavy database queries: large wp_options autoload data, unindexed meta queries, huge wp_postmeta tables.
Time a request yourself
curl -s -o /dev/null -w 'connect %{time_connect}s first byte %{time_starttransfer}s total %{time_total}s status %{http_code}\n' https://example.com/SLOW_PATH
Run this on your computer. Replace example.com with your domain and SLOW_PATH with the URL from the log. -w prints timing fields: time_starttransfer is time to first byte, which is mostly PHP time. A healthy uncached WordPress page usually returns its first byte in well under a couple of seconds. A first byte close to 60 seconds, followed by a 504, confirms the timeout.
Profile it in WordPress
Install Query Monitor on a staging copy, or briefly on live for admins only. Load the slow page and open its panel: “Queries by Component” shows which plugin runs the slowest database queries, and “HTTP API Calls” shows slow remote requests with their duration. For requests that time out before the page renders, PHP-FPM’s slow log is better; see the Advanced section.
Step 5: Fix long-running work properly
Move it to the command line. WP-CLI has no web timeout. For example wp import FILE.xml --authors=create runs a WordPress XML import (it needs the WordPress Importer plugin active), and wp action-scheduler run processes WooCommerce’s background queue. Many import and backup plugins document their own WP-CLI commands.
Use a real cron. Add define( 'DISABLE_WP_CRON', true ); to wp-config.php and schedule wp cron event run --due-now from the server’s crontab every few minutes, so visitors never trigger heavy jobs.
Batch it. Choose plugin settings that process in small chunks (for example 50 records per request) instead of everything at once.
Remove or replace the slow plugin if a remote API or a bad query is the cause and the vendor has no fix.
Step 6: Varnish and load balancer variants
Varnish
Varnish reports back end failures as Error 503 Backend fetch failed with a “Guru Meditation” XID number. The XID identifies the request in varnishlog. The relevant timeouts are first_byte_timeout and between_bytes_timeout, both 60 seconds by default as global parameters, and they can be overridden per backend in the VCL. If PHP is fine but Varnish still fails, check that the backend host and port in the VCL match where Nginx or Apache actually listens.
Load balancers and hosting proxies
Cloud load balancers and the reverse proxies managed hosts put in front of your server have their own idle or read timeouts, commonly 60 seconds. A 504 page in the load balancer’s style, with nothing in your Nginx log, means the balancer gave up while your server was still working. A 502 from a balancer often means its health check marked your server unhealthy, or your server closed the connection. Raising your own timeouts above the balancer’s has no effect; the slowest request must get faster, or move to a background job.
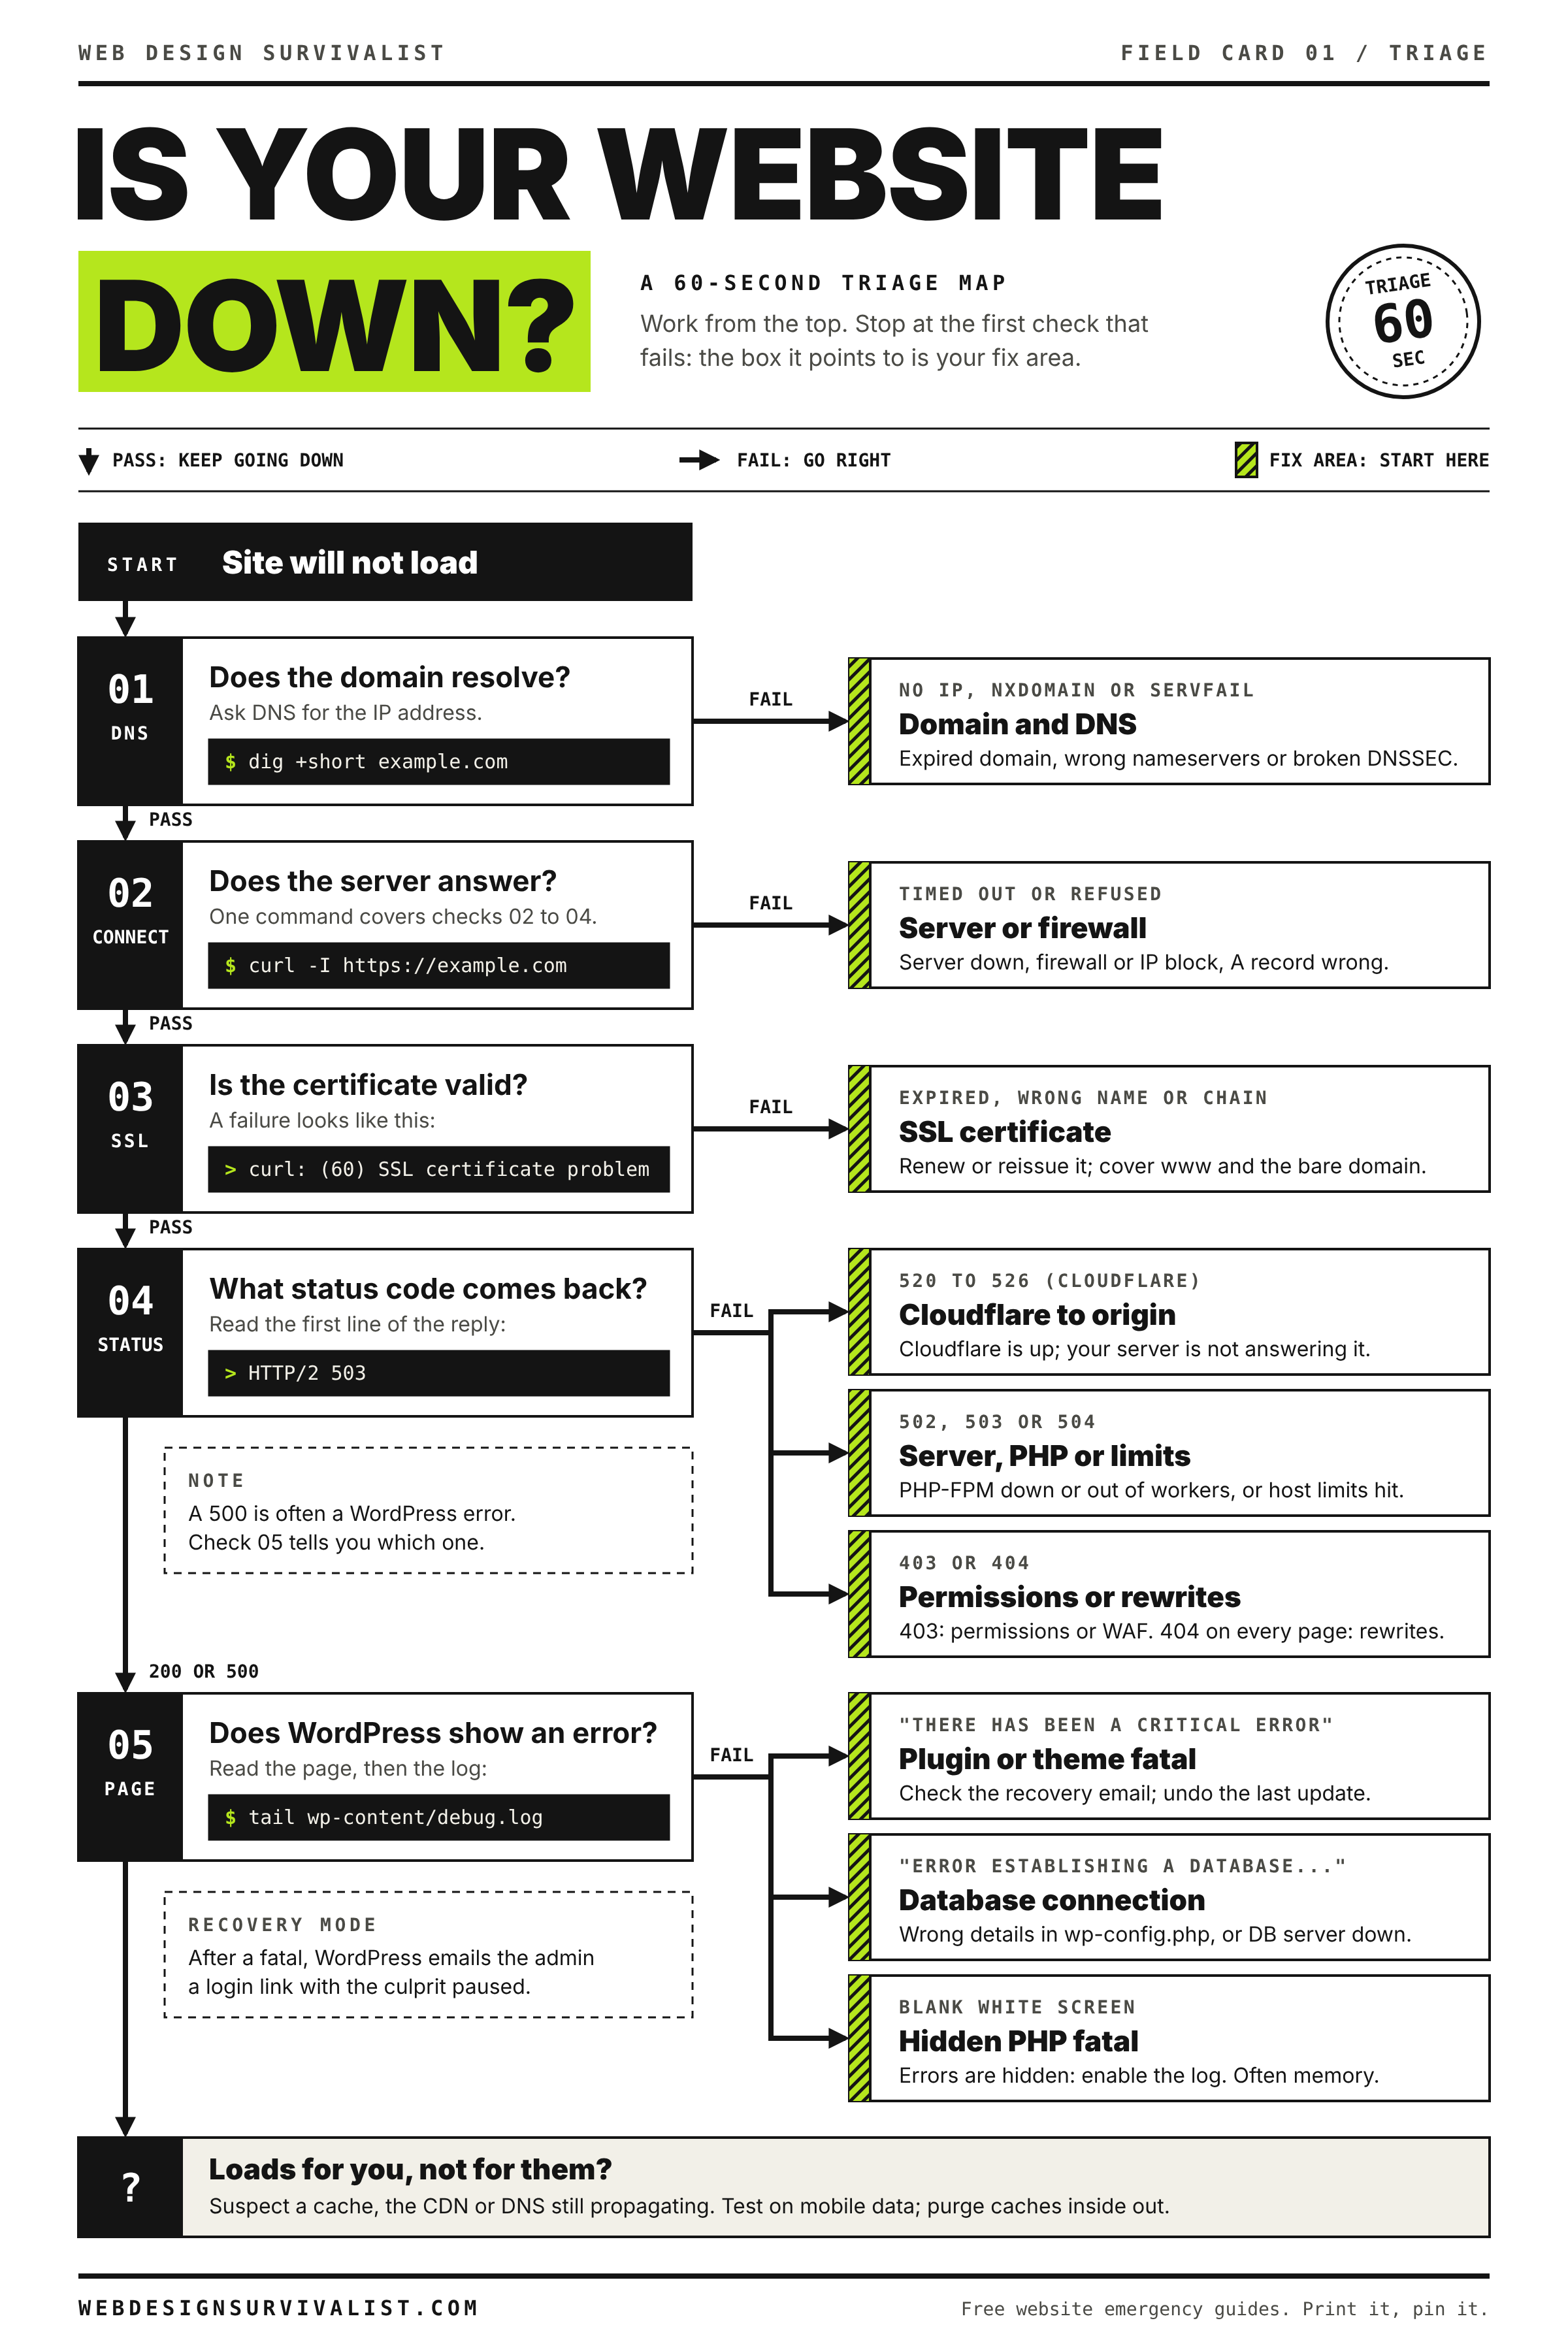
Field card 01: Is your website down? A 60-second triage map. Print it on any black and white printer. All field cards
Advanced: PHP-FPM status page and slow log
On a server you control, two PHP-FPM features turn guesswork into data.
These lines go in your PHP-FPM pool file, such as /etc/php/8.3/fpm/pool.d/www.conf. PHPFPM_POOL_NAME is the pool name in square brackets at the top of that file. Expose /fpm-status in Nginx only to localhost (a location = /fpm-status block with allow 127.0.0.1; deny all; and the same fastcgi_pass as PHP). Restart PHP-FPM afterward.
curl -s http://127.0.0.1/fpm-status
Run this on the server itself. Read these fields: active processes against total processes (workers busy now), listen queue (requests waiting for a free worker; above zero for long means you are out of workers), max children reached (how often the limit was hit since FPM started) and slow requests. A climbing listen queue with active equal to total confirms worker exhaustion.
Reading the slow log
Every request that runs longer than request_slowlog_timeout gets a PHP stack trace written to the slow log, with the deepest function first. Read from the top down until you reach a path under wp-content/plugins/ or wp-content/themes/: that is the plugin or theme holding the worker. Functions such as curl_exec or mysqli_query near the top tell you whether it was waiting on a remote call or the database.
These go in the Nginx config: log_format in the http block, access_log in your site’s server block. $request_time is total time and $upstream_response_time is time spent waiting on PHP. After a reload, rank the slowest PHP requests with sort -t= -k3 -rn FILE | head (split on the equals sign, sort numerically by the third part, which is the upstream time), and you have a ranked list of slow URLs for every future incident.
When to contact your host
On shared and managed hosting you cannot restart PHP-FPM or change proxy timeouts, so open a ticket with evidence:
The exact error page text and which software it names (nginx, Varnish, a load balancer).
UTC timestamps of several failures, to the minute.
The failing URLs and HTTP methods (GET or POST), and whether all pages fail or only some.
Any upstream log lines you can see, or the output of the curl timing test.
What runs at those times: imports, backups, cron jobs, a marketing email going out.
A direct question, for example “Is PHP-FPM reaching max_children on my account?” or “What is the proxy read timeout in front of my site?”
Our diagnostic tools can confirm status codes and response times from outside. If the site is down completely right now, use the Emergency Room checklist first.
Did this fix it?
Still stuck? Start again from what you can see in the Emergency Room.
Still stuck?
Print a free one-page checklist to keep, or open the Emergency Room if the symptom does not match.
The web server hit something it could not handle and gave up. Read the error log, test .htaccess, then check permissions, the PHP handler and security rules, in that order.
Your account or server ran out of PHP workers, processes or CPU. Find which limit was hit, find the URLs and bots eating it, then cache, block or upgrade.
The front end is fine but wp-admin crawls. Find the real cause: Heartbeat and admin-ajax, update checks, WP-Cron, Action Scheduler backlogs or heavy list screens.